Gas market trends
What’s been happening?
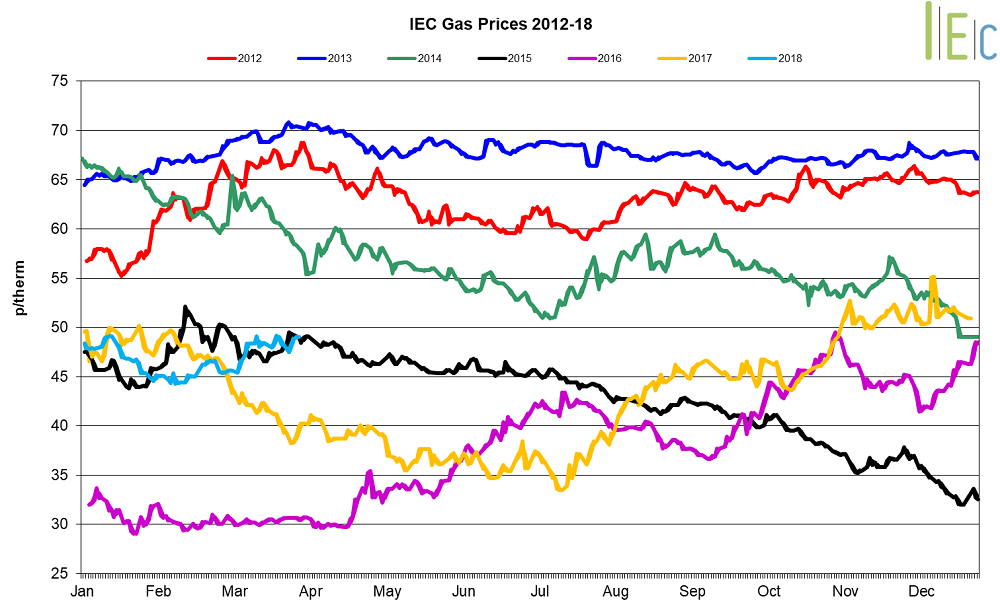
- Day-ahead gas prices grew 17.8% to average 64.1p/th. On 1 March prices reached its highest level since at least 2008 (125.0p/th)
- The month-ahead (April) gas contract climbed 6.9% to average £49.8/MWh
- Bullish growth was observed across all seasonal gas contracts, rising 2.4% on average
- The largest gains were on the near-curve as summer 18 and winter 18 gas increased 5.8% and 4.1% to average 44.8p/th and 52.3p/th respectively
- Summer 19 gas lifted 0.8% to 39.9p/th, while winter 19 and summer 20 contracts climbed to 48.1p/th (up 1.1%) and 38.1p/th (up 1.4%)
- The annual April 18 gas contract lifted 4.9% to 48.6p/th
Key market drivers
- Early month gains in spot prices were driven by National Grid announcing a gas deficit warning, while demand sored to a five-year high. Outages at South Hook LNG terminal and the Kollsnes gas processing site further tightened supplies
- With gas storage levels low across the UK and Europe, tightened supplies throughout large periods of March caused sustained high prices in the day-ahead market
- However, forecasts of increased pick-up in LNG deliveries pegged back gains towards the end of the month
* £ per p/therm (Annual Forward Average)
Electricity market trends
What’s been happening?
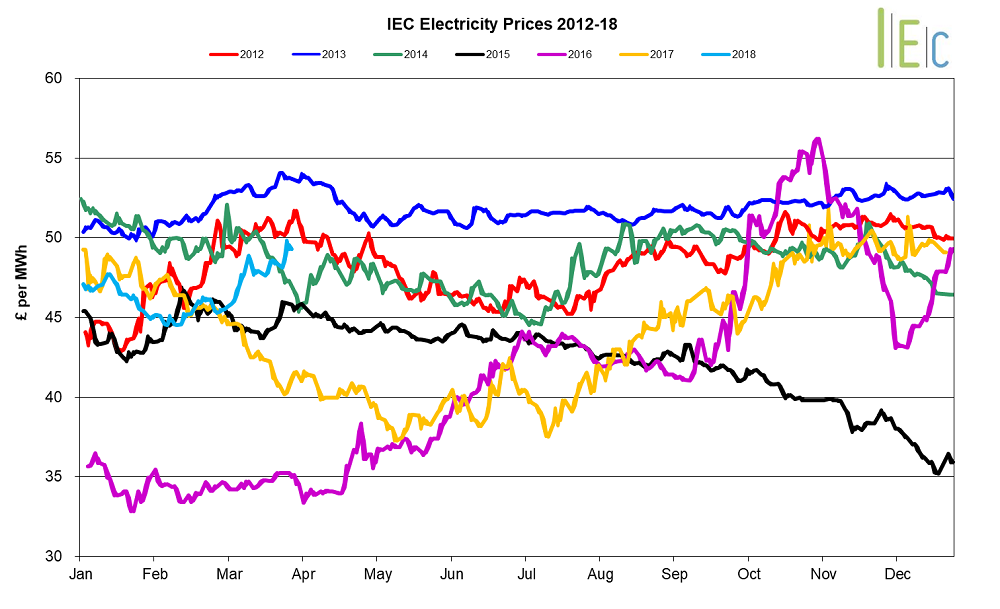
- Last month day-ahead power leapt 12.3% to average £57.9/MWh. On 1 March prices reached an 18-month high of £98.0/MWh
- The month-ahead (April) power contract climbed 5.3% to average £48.9/MWh
- On average seasonal power contracts grew 1.8% across March
- The summer 18 and winter 18 contracts lifted 4.8% and 4.1% to average £45.3/MWh and £51.0/MWh respectively
- Summer 19 and winter 19 also saw growth, up 2.5% and 2.7% to £41.1/MWh and £47.1/MWh. However, the summer 20 power contract fell 0.5% to £38.4/MWh
- The annual April 18 power contract increased 4.4% to average £48.1/MWh
Key market drivers
- Prices at the start of the month rose amid high levels of demand, coupled with an array of outages across CCGT and nuclear assets across the UK
- Bullish gas and carbon prices throughout the month supported most power contracts along the forward curve
- Low levels of gas in storage across the UK and Europe will increase gas demand for injection over summer months. This could provide some support to gas and power prices during summer months
* £ per MWh (Annual Forward Average)
European gas
- Most tracked European gas markets have undergone bearish movements from the previous month’s highs
- GB prices ended the month 1.2% below Belgian prices, 0.6% higher than German prices and 2.7% greater than Dutch prices
- At the start of the month a Siberian weather system swept across Europe, causing temperatures to fall around 10 degrees below seasonal normal levels. This resulted in record levels (six-year high) of gas and power demand throughout north-west Europe. A series of outages and no major LNG shipments also caused gas supplies to tighten across the continent
- Day-ahead gas prices in Europe exceeded 200p/th in reaction to the events. Without reliable supplies from Norway due to an unplanned outage at the Kollsnes gas processing plant, Russian supplies were left as the only source of swing volume. This resulted in Gazprom posting a new daily record of 695.1mn cm of gas delivered to customers on 1 March
- However, after the initial high prices experienced at the start of the month, supplies stabilised as outages were reverted and demand for gas eased
Gas demand throughout Germany, France, Belgium and the Netherlands to fell to ~1.28Bcm (down from 1.43Bcm) on 3 March as temperatures in the region began to bolster across the continent and would continue to do so for large periods of the month - Belgian Zeebrugge gas prices continued to ease for large periods of the month due to strong withdrawals from Loenhout (Belgium’s only gas storage reservoir), easing supplies. However, by mid-March capacity at the reservoir fell below 10%
European power
- European power prices experienced across March. The most notable of change was observed in France
- GB prices ended the month 27.6% above French prices, 32.3% higher than German prices and 16.5% below Dutch prices
- Periods of strong solar and wind generation weakened prices across large periods of the month helped to depress French power prices. However, prices were supported rising German power and EU ETS carbon prices. In addition, French prices grew start the start of the month amid unplanned outages across a number of nuclear units. An example being the 1.3GW St Alban-1 nuclear reactor which had to reduce generating capacity to 500MW until 5 March
- Modest growth was observed in Germany, driven by bullish EU ETS carbon prices. However, high renewable generation and easing power demand pegged back gains. Towards the end of the month German power prices experienced negative pricing amid robust renewable output
- Periods of high power demand in France pegged back bearish prices in the country. For example, on 19 March it was reported that French peak power demand rose to 80GW, a notable increase when compared to peak demand during the cold snap in late February which reached 95GW
- Output from German gas-fired plants fell to their lowest level this winter in the week ending 16 March, as higher gas prices weakened the economics of gas-fired generation, with coal generation providing backup for strong wind generation. Output from gas plants averaged 3.5GW compared to 9.4GW from coal-fired power stations
World oil
- Brent crude oil prices boosted 0.4% to average $65.9/bl during March, up from $65.6/bl the previous month.
- News that OPEC and non-OPEC members achieved 138% compliance with agreed output cuts in February helped push prices higher. Despite gains, Brent crude oil prices continued to be weighed down by bearish fundamentals brought upon by increasing US crude production.
Coal
- API 2 coal prices continued to decline in March, falling 4.9% to average $76.7/t, down from $80.7/t the previous month. This is its lowest monthly average since July 2017.
- Coal prices weakened amid decreased demand from the Asian/Pacific market. Chinese production also climbed over the past two-months, up 5.7% year-on-year, easing demand for imports. A weakening Euro against the dollar added to the bearish fundamentals.