Gas market trends
What’s been happening?
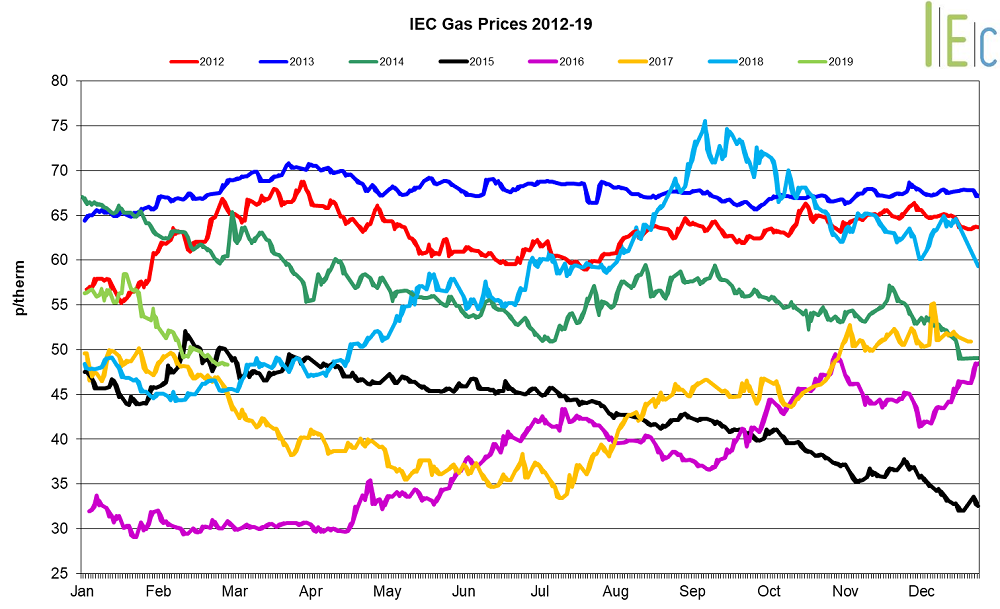
- In February, day-ahead gas fell for the fifth consecutive month, down 18.9% to average 47.4p/th
- The month-ahead (March) gas contract dropped 18.1% to average 47.3p/th
- All seasonal gas contracts fell in February, dropping 5.3% on average
- Summer 19 gas saw the biggest change, falling 12.6% to average 46.0p/th. The contract hit a 10-month low of 44.1p/th on 25 February. However, the summer 19 contract is 16.0% higher in February 2019 than it was in February 2018, when it was 39.6p/th
- The annual April 19 gas contract decreased 8.8% to 52.2p/th but was 19.9% higher than in February 2018 when it averaged 43.6p/th

* £ per p/therm (Annual Forward Average)
Key market drivers
- Gas prices have dropped as temperatures soared well above seasonal normal levels to set new record winter temperatures across the UK. Warmer weather led to weaker gas demand across the month, which resulted in an oversupplied gas system following the arrival of 12 LNG tankers to GB terminals
- Average demand on the National system fell month-on-month, down from 335.2mcm/d in January to 280.0mcm/d. Regional gas demand also dropped month-on-month, falling from 234.3mcm/d in January to 197.7mcm/d in February.
Electricity market trends
What’s been happening?
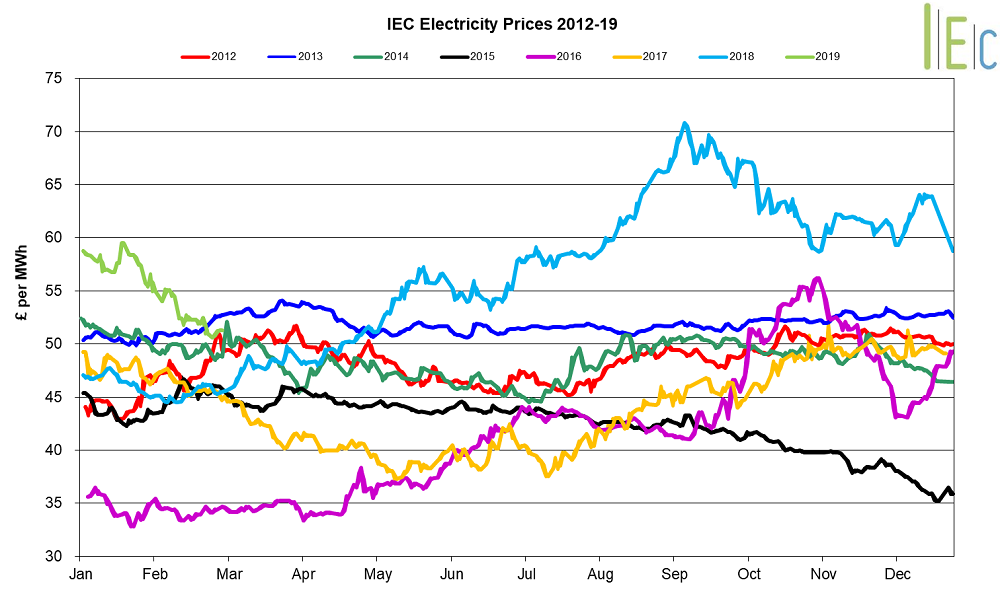
- Day-ahead power dropped 19.5% to average £50.2/MWh in February. The contract went as low as £47.3/MWh on 25 February, as lower gas prices offset forecasts of lower wind generation
- March 19 power fell 13.8% to average £50.7/MWh
- All seasonal baseload power contracts decreased in February, down 4.8% on average
- Summer 19 power averaged £49.7/MWh, down 9.8% from January, with the contract dropping to a nine-month low of £47.5/MWh on 25 February
- The annual April 19 power contract declined 7.2% to average £54.3/MWh, but was 26.2% above its price in February 2018 when the contract was at £43.0/MWh
 * £ per MWh (Annual Forward Average)
Key market drivers
- Day-ahead power prices continued to follow their gas counterparts lower and were also pressured by a fall in EU ETS carbon prices. CCGT generation remained dominant in the supply mix, providing 42.1% of the generation mix in February, down from 48.4% in January
- Average daily demand decreased month-on-month, falling from 0.895TWh/d in January to 0.820TWh/d in February. Average peak demand also fell month-on-month, down from 45.4GW in January to 42.8GW in February. Both average daily demand and peak demand were 8% below the five-year average for February, which is 0.894TWh/d and 46.7GW respectively
European Gas
- All tracked gas markets fell in February. The largest decline was observed in the day-ahead Belgian Zeebrugge contract, which dropped 7.3p/th to end the month at 55.3p/th
- European prices fell as temperatures across the region were well above seasonal normal levels. This led to lower gas demand, and resulted in oversupplied gas systems following the continued high volume of LNG deliveries coming into Europe
- A total of 25 LNG tankers arrived in GB, the Netherlands and Belgium in February, slightly down from the 27 arrivals in January. Comfortable gas storage levels at present (~48% full on average) in NW Europe may deter some cargoes from coming to the region as the winter gas season comes to an end
- Gas price drivers across Europe are expected to remain bearish into March, with comfortable supplies forecast to continue and easing demand as we head into Spring
- Although gas prices in Europe are expected to remain at a premium rate to Asian LNG prices in the near-term, any changes to weather related demand in either region could tip the balance as LNG send-out remains the marginal supply source in the gas mix across Europe
- BP released its annual Energy Outlook, which details a range of scenarios exploring different aspects in the energy transition. The report highlights the growing import requirements for gas in Europe, with domestic production dropping and being replaced by rising LNG and Russian gas supplies. In the report’s projections, gas demand is expected to remain relatively flat in the region
European Power
- All tracked European power contracts fell month-on-month. Dutch power prices experienced the largest movement, falling £16.8/MWh to end the month at £35.8/MWh
- European power prices have followed their gas counterparts lower, as warmer temperatures dampened energy demand across the region
- German power prices were down £8.7/MWh to end February at £35.8/MWh. Prices were pressured by high wind generation towards the end of the month, which was up to 30% above normal output levels for the country’s wind farms
- Despite higher wind generation towards the end of the month, periods of lower wind output during February saw Germany’s lignite-fired power production rise to its highest level since July 2018, with peak output above 17GW on 21 and 22 February
- With gas prices expected to remain low amid comfortable supplies and declining demand as we enter spring, European power prices are also expected to follow suit
- BP’s recently published annual Energy Outlook, said it is expected that the EU will maintain its position as a market leader in renewables penetration, with renewables expected to account for 50% of the region’s power generation mix by 2040
World Oil
- Brent crude oil prices rose for the second consecutive month, up 7.0% to average $64.3/bl in February, peaking at a three-month high of $68.0/bl.
- Brent crude oil prices continued to recover in February, with OPEC’s production cuts taking the group’s supply to four-year lows, and sanctions on Venezuela and Iran further acting to reduce global oil supplies. This growth was despite US crude oil output hitting a record 12mn bpd towards the end of the month, and concerns that the ongoing US-China trade war would dampen global economic growth and reduce oil demand. According to a report by the Bank of America Merrill Lynch, Brent crude oil prices are expected to average $70/bl in 2019.
Coal
- API 2 coal prices experienced a second consecutive monthly decline, down 6.8% to average $78.6/t in February.
- API 2 coal prices fell for a second consecutive month, down 6.8% to average $78.6/t in February. Coal prices slid amid weak demand in the Northern Hemisphere, as both Europe and
- Asia faced temperatures well above seasonal normal levels. Pressure also came from the week-long Chinese New Year holidays early in the month, and from news that Glencore, which accounts for 25% of global thermal coal supply, will not increase production beyond 2019.
Carbon (EU ETS)
- EU ETS carbon prices fell for the first time in three months, down 10.2% to average €21.1/t. Prices have decreased from the previous month as warmer weather reduced fossil fuel power generation across Europe, and therefore lowered demand for emissions allowances.
- Ongoing talks about coal phase-out plans across the EU, as well as the potential for stricter emissions reductions by 2030, have also pressured carbon prices in February.
- In February, Energy and Clean Growth Minister Claire Perry said that the government is working to establish a domestic carbon emissions trading system that it hopes to connect to the existing EU Emissions Trading Scheme (ETS) from January 2021. Perry said that if the UK leaves with a deal, it will remain in the EU ETS until the end of the current trading phase at the end of 2020. There have been concerns that carbon emitters based in the UK will not have to pay these charges in the event of a no-deal Brexit.
